Death Rates by Age

(csbsju.edu)
This graph compares the number of deaths due to influenza and pneumonia in the years 1911-1917 to the influenza and pneumonia deaths in 1918. It shows that in 1918, infants elderly people were the most susceptible to these two diseases. This is probably because the immune system in infants is not very developed, and in elderly people it is weakened. Also, influenza and pneumonia killed more people 75 years old and older from 1911-1917 than in the year 1918, which did not occur in any other age group. Adults in their prime, around 25-34 years old, also had a high number of deaths due to influenza and pneumonia. Usually influenza does not affect young adults very much, which is indicated by their close to zero death rate due to influenza and pneumonia from 1911-1917.
Death Rates by Month

(csbsju.edu)
The deaths in the U.S. for the years 1911 to 1917 and 1918 for all the months are being compared. The 1918 influenza was about as powerful as seven years of influenza combined for most of the year. It was deadlier between 1911 and 1917 in January, March, and April, but was not as deadly in February, and May through August. The first months were the first wave of influenza that did not kill that many people. Then it weakened, but got stronger several months later. During the months of September, November, and December, the influenza killed about 15 to 20 per 1000 people. In October, the 1918 influenza was at its strongest, killing about 50 people in every 1,000.
Total Deaths With Flu and War
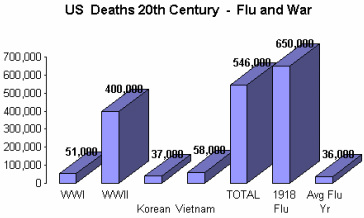
(csbsju.edu)
The number of people's deaths caused by different disasters is being compared here. The 1918 influenza caused more deaths in the U.S. than World War I and II, the Korean War, and the Vietnam War combined. The chart shows that the influenza killed about 104,000 more people than all those wars combined, and killed around 614,000 more than the average influenza deaths per year.